By
Posted on Published:
Categories Global weather
A powerful Super El Niño is rapidly developing in the tropical Pacific, and the first clear atmospheric response is already showing up in the weather patterns. Latest ocean and forecast data show the event strengthening toward rare intensity, with the atmospheric signal already visible in the analysis and forecast data.
June already produced a pattern similar to past Super El Niño years, with temperature and pressure anomalies emerging across the United States and Canada. The July forecast now shows the next phase, as the Pacific signal deepens and begins to shape the global weather.
In this article, we look at the latest ocean data, atmospheric forecasts, and historical Super El Niño patterns to track how this event is rapidly spreading its influence in the atmosphere. You will also see what the July forecast suggests for North America, and why late summer into Fall could bring an amplified pattern across the United States, Canada, and now also Europe.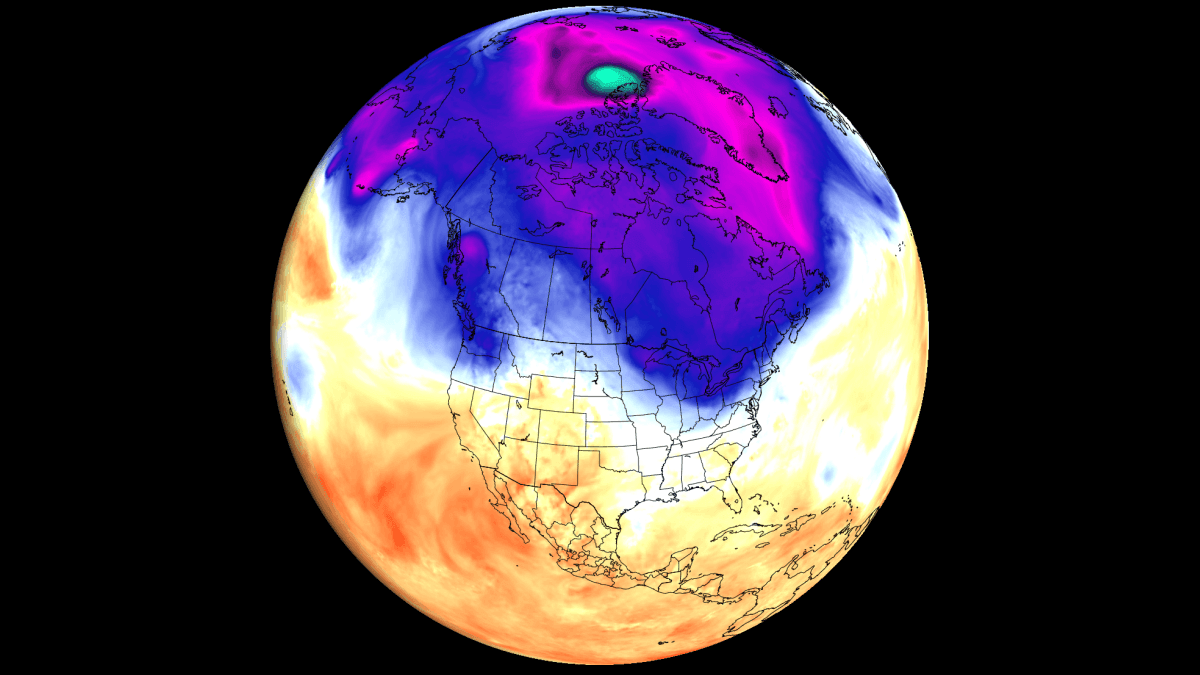
All official predictions and analysis shows that an El Niño event will be the main global weather driver in 2026/2027. This is a warm phase of the ENSO region in the equatorial Pacific Ocean that alternates between warm and cold phases every few years.
We are entering a new cycle, with a strong El Niño already emerging, so we can look at the usual impact it has on the atmospheric circulation. Specifically, we look at the upward and downward atmospheric motion in the tropical regions, also known as the Walker Cell, which is especially sensitive to strong ENSO events.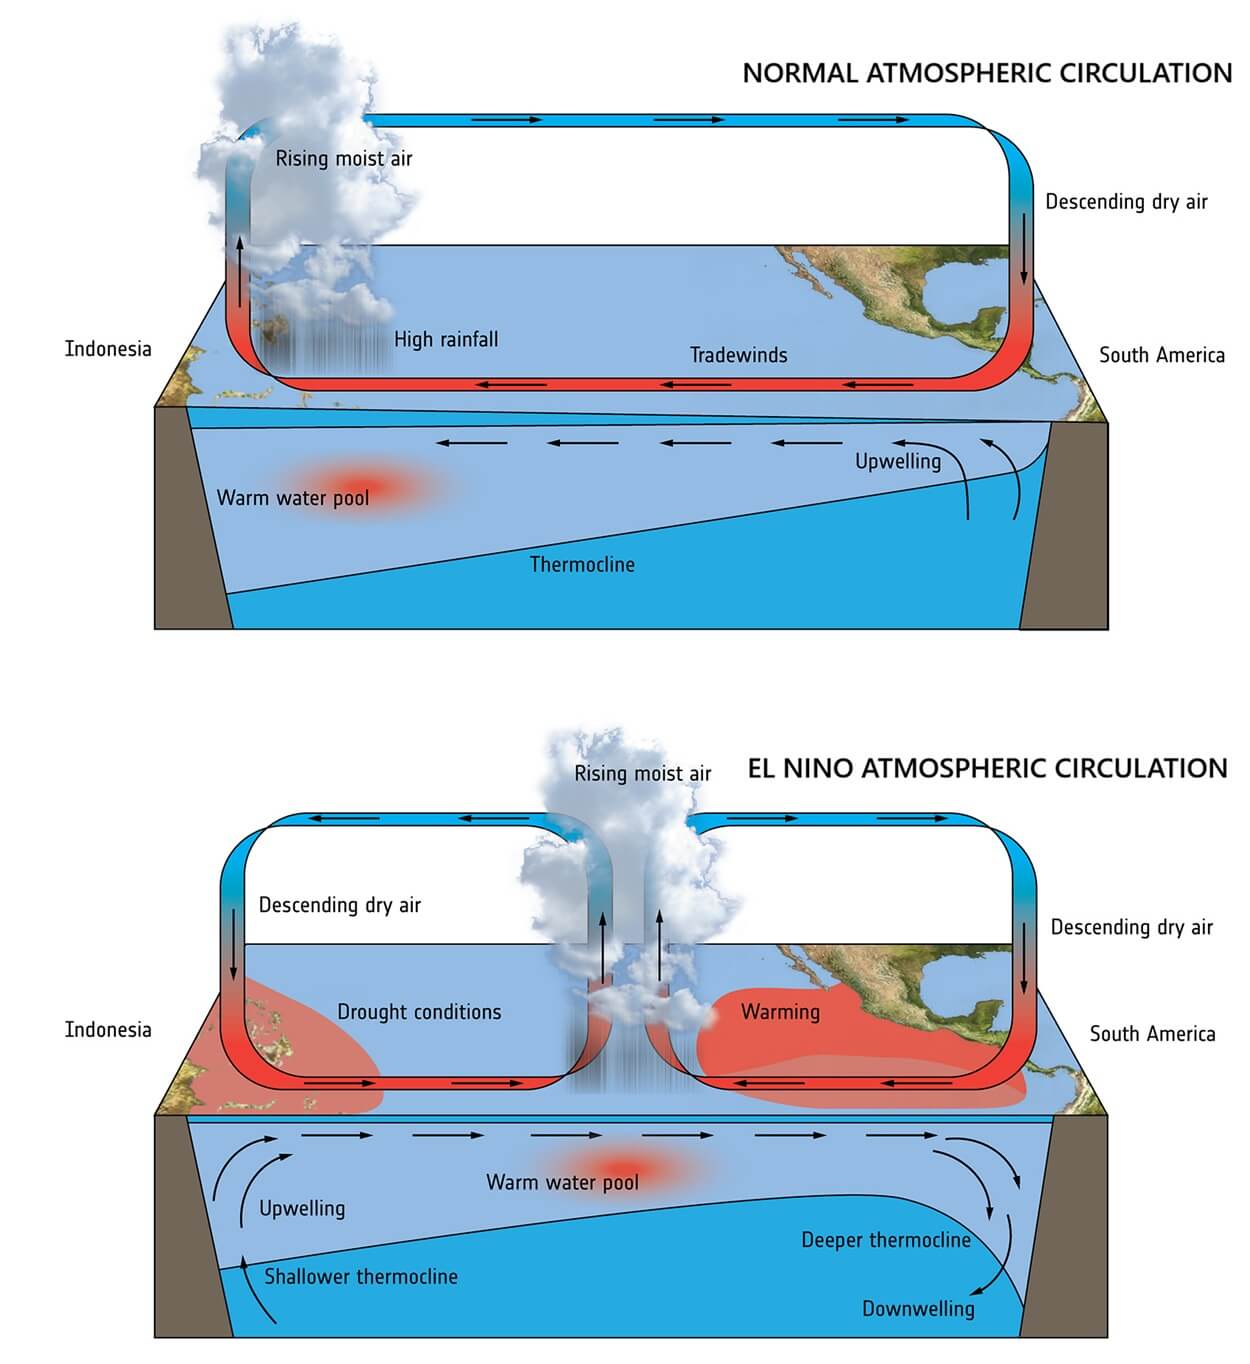
The schematic above, by ESA, shows the changes in this atmospheric motion cell during a normal atmosphere (ENSO neutral) versus an El Niño event. It shows a large shift in the global atmosphere with a so-called atmospheric bridge that changes the atmospheric flow, impacting global weather development.
The latest ocean analysis below shows a significant warm anomaly already emerging in the main ENSO regions. This analysis is with the global average anomaly removed, so it shows the clean warm signal of the rising El Niño, creating a growing warm anomaly signature, expected to reach into the +4-5° anomalies at peak strength.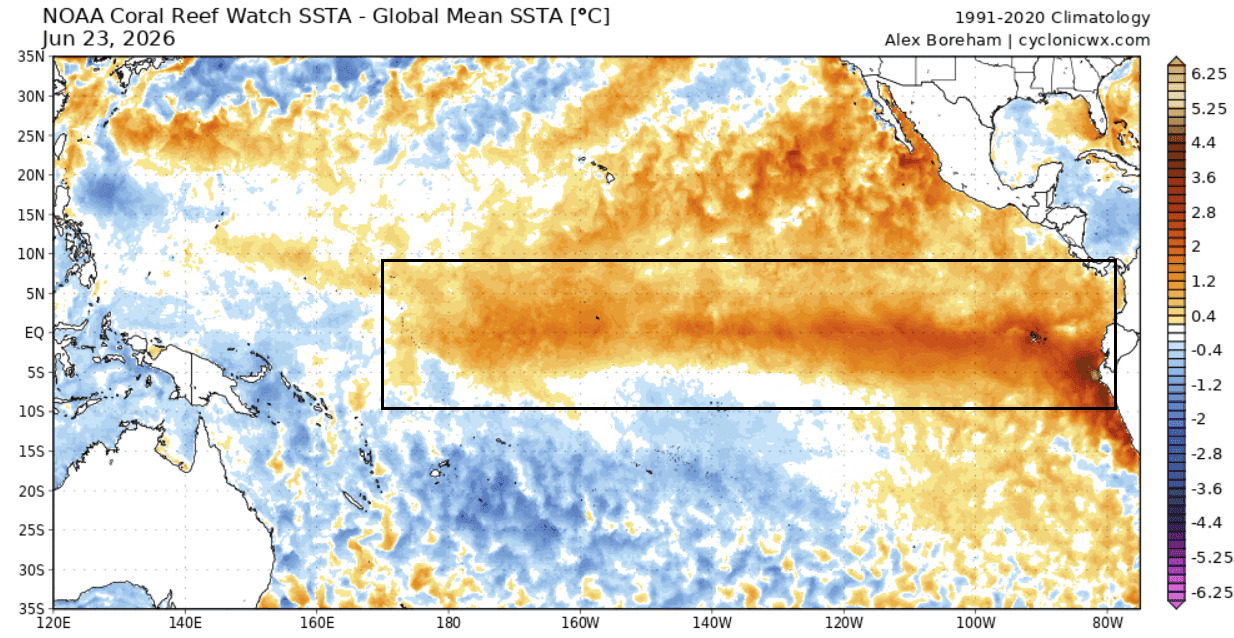
This is reflected in the latest ENSO forecast from the NCEP CFSv2 model. It shows a very strong El Niño developing, exceeding the super El Niño threshold (+2 degrees), having an immediate impact on the summer, fall, and winter patterns. The current 2026 development shows a similar signature to the previous strongest events, forecast to rise even higher, as one of the strongest events on record.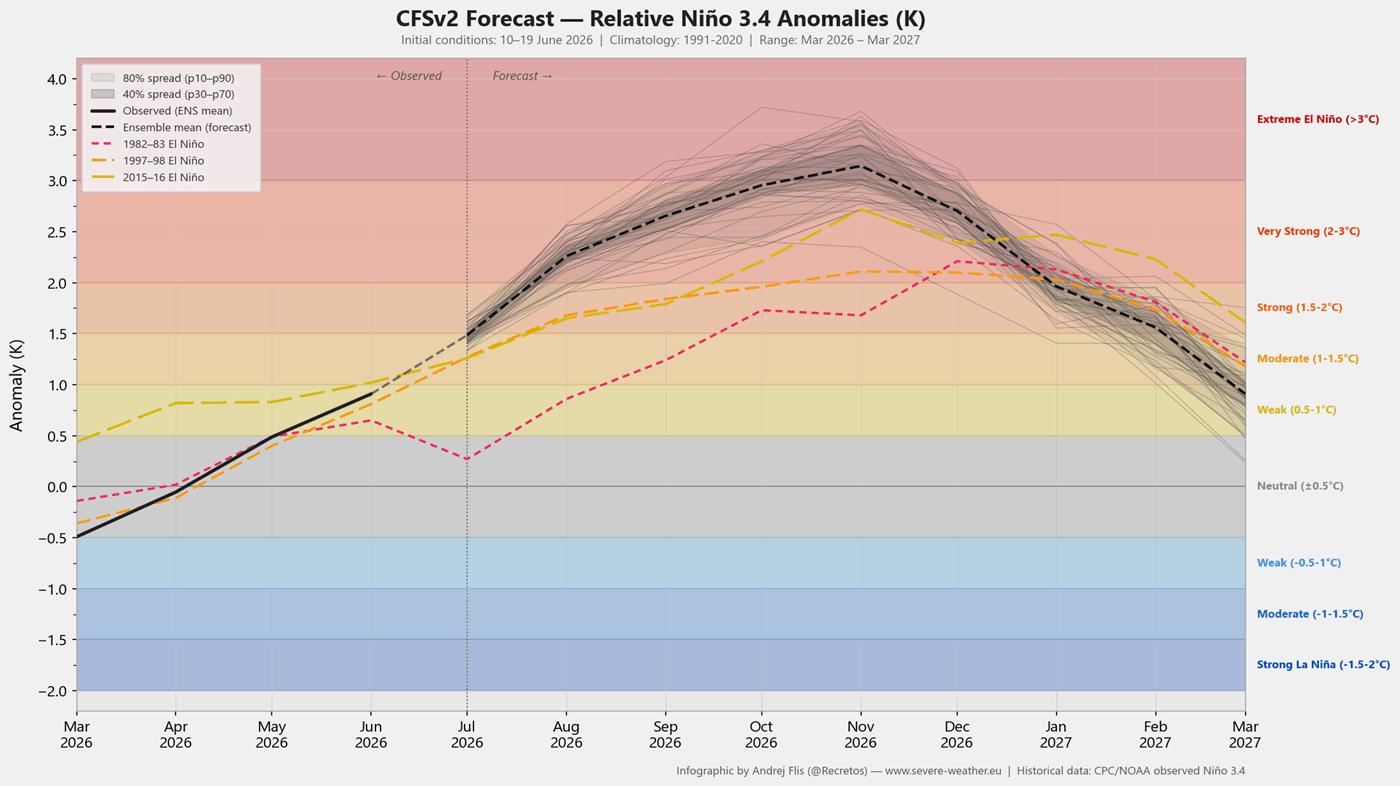
A super El Niño event usually leads to more extreme weather shifts, amplifying normal seasonal changes into high-impact weather events. Often, that results in massive flooding, severe droughts, severe storms, and significantly altered pressure system tracks that can affect the entire planet.
Strong westerly wind events have helped develop a massive underwater warm anomaly, called a Kelvin Wave. This wave rises from below, now visible as a warm anomaly on the ocean surface that we call the El Niño. We produced a video below that shows the past weeks of subsurface temperature anomalies in the region, showing clear movement of this unusually strong Kelvin Wave and its eventual rise as a super El Niño.
Below is the NOAA CPC strength probability, which also shows the likelihood of a strong El Niño event, peaking in late Fall and early Winter. We can see a very high chance for a super El Niño event, expected to overhaul the global seasonal weather patterns.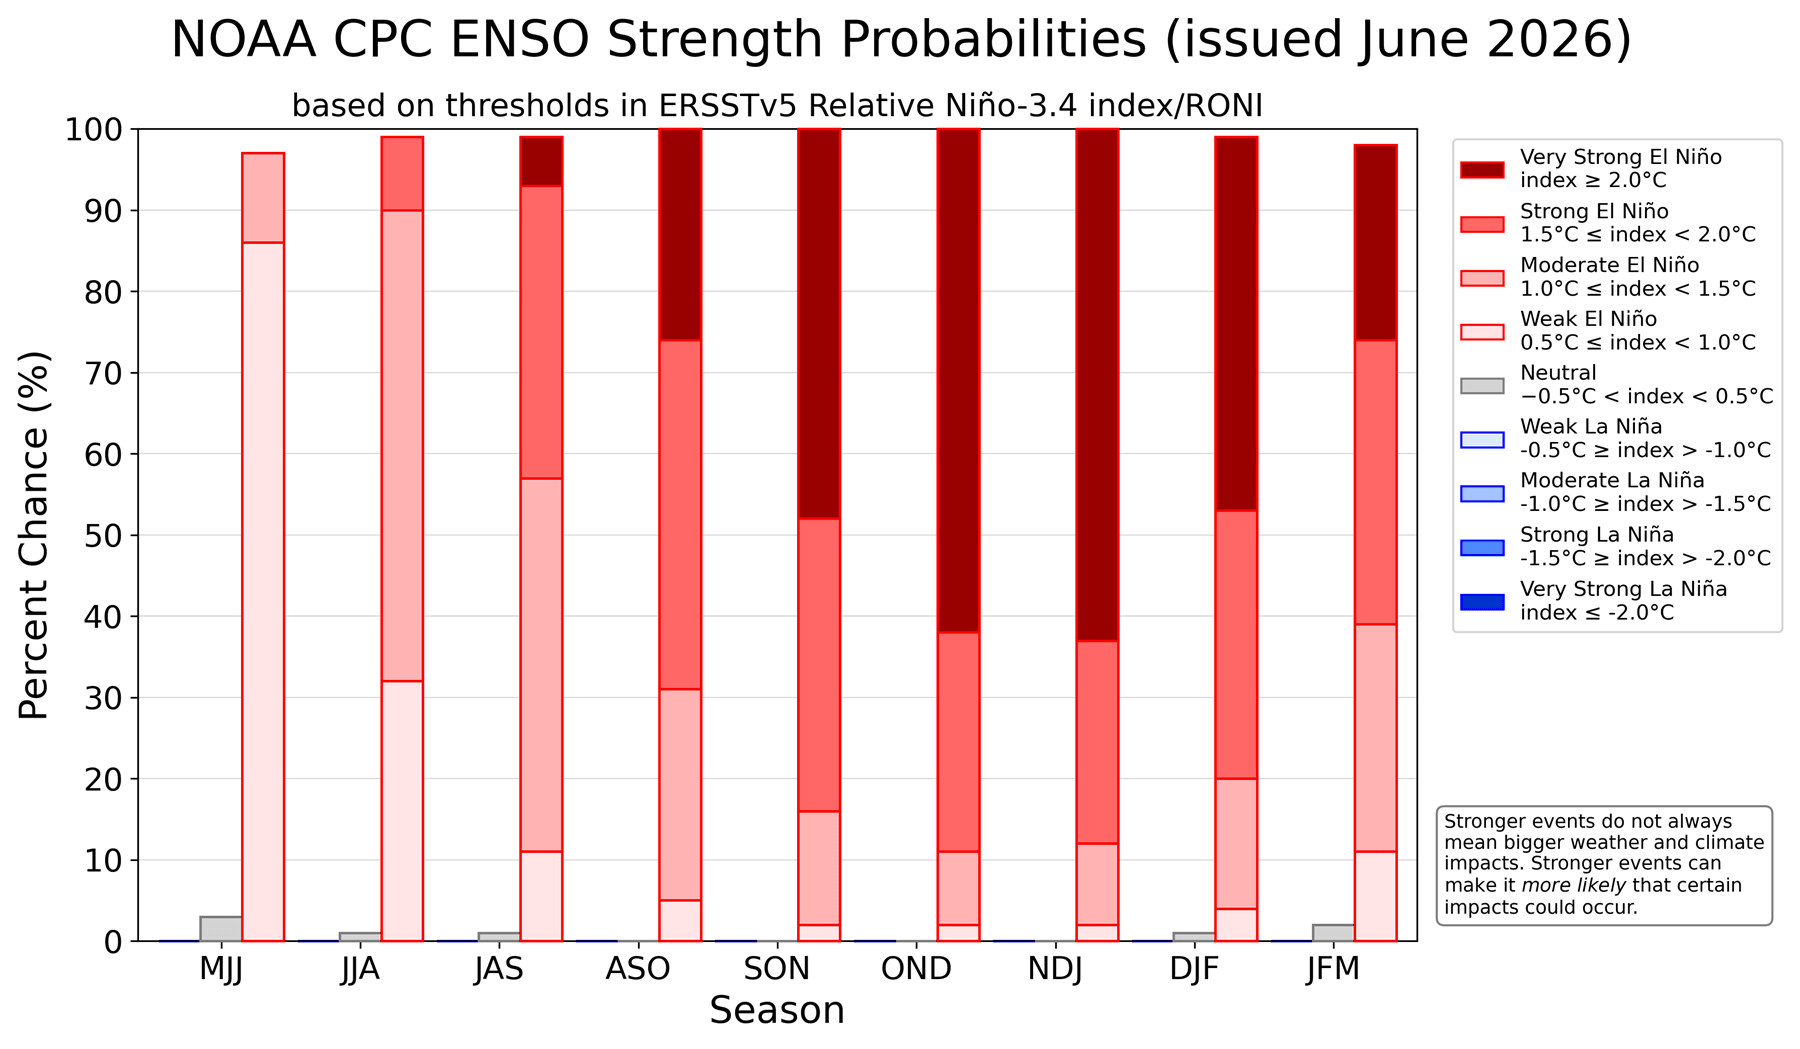
El Niño events tend to reach peak anomaly later in the year. The latest forecasts now extend into early Winter, revealing significant ocean temperature anomalies through December 2026. You can see this in the forecast below, with anomalies peaking over +5 degrees. Anomalies of this magnitude could merit this as a historically record-strong El Niño event.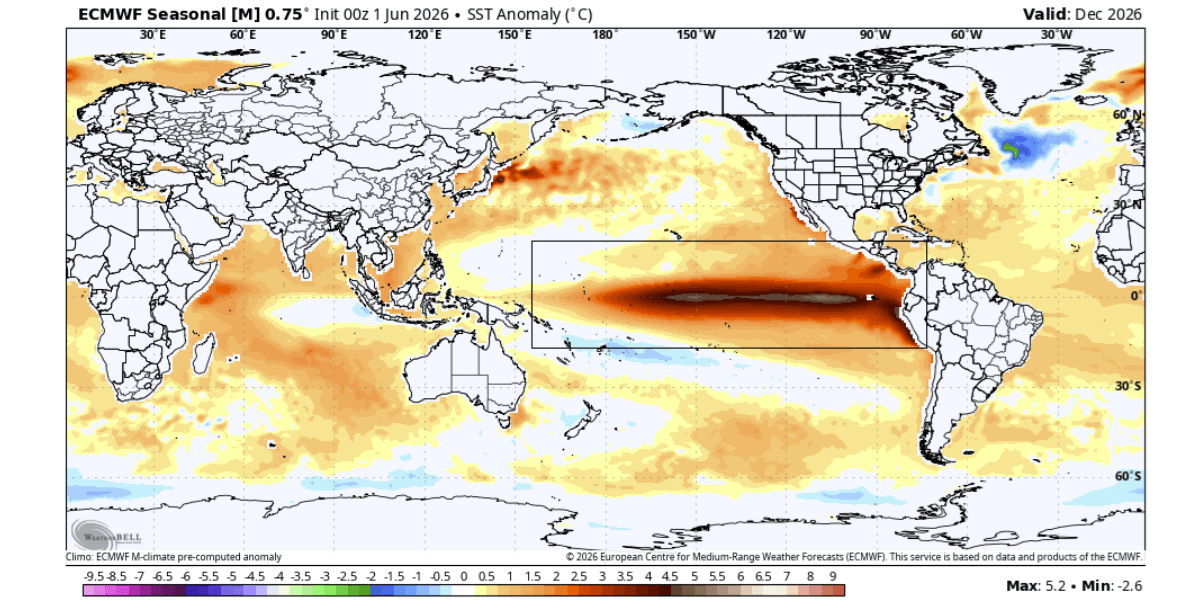
But even before getting into Winter, we are already tracking current atmospheric changes in Summer, driven by the emerging super El Niño.
We are nearing the end of June, but this month has already shown a very clear pattern that matches the past super El Niño June months. As North America is close to the ENSO regions, we usually see pattern changes here first, and Europe usually follows in the Fall season, which we will cover further below.
Below is the June temperature anomaly for the last 4 super El Niño events. It shows a below-normal temperature trend over eastern Canada and the central and eastern United States, with the warm anomaly in the north and northwest. It shows the northerly flow pattern in the east, and a warmer flow in the west.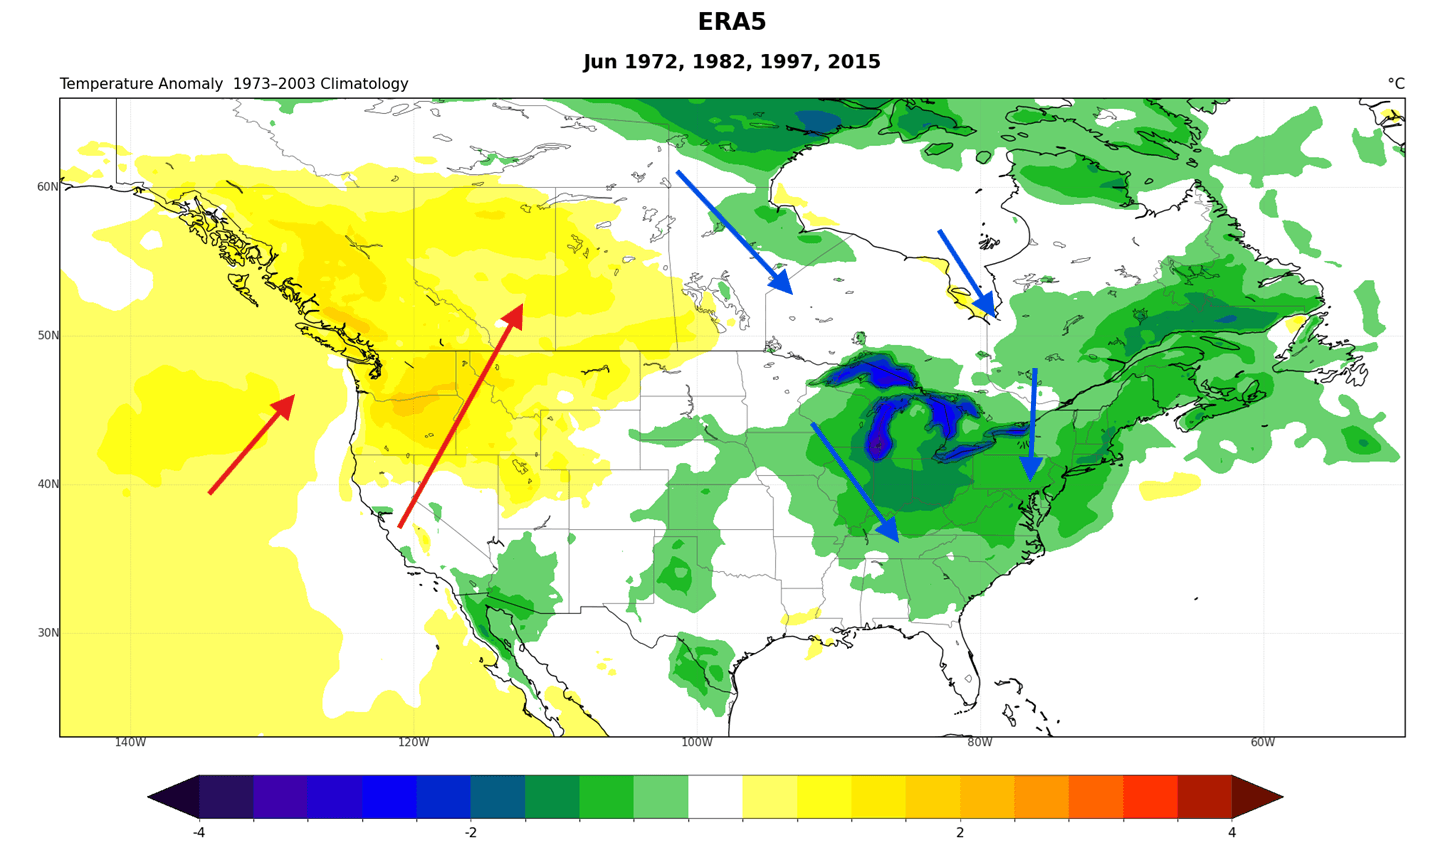
We used an older climatology period to normalize the anomalies, since the super El Niño events span several decades in the past, and need to be comparable with current forecasts.
Now we can look at the temperature analysis for the month so far (left) and the past 10 days (right), which reveals a strong pattern. What you can see is almost an identical trend to the past super El Niño events above in June.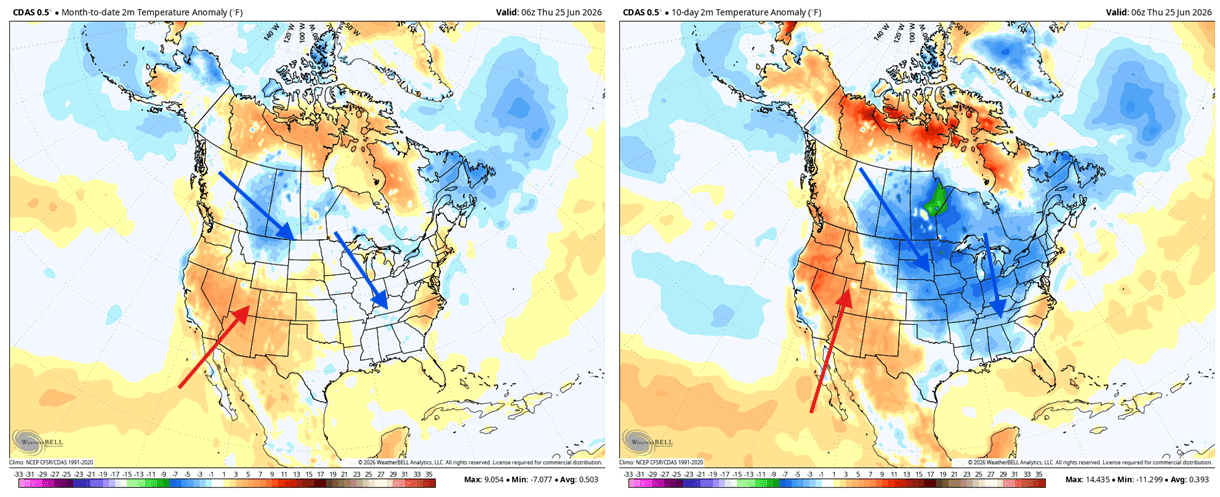
This comes from the pressure pattern, which in a rising super El Niño favors a low-pressure area development over eastern Canada and the eastern United States. That allows a more northerly flow to develop, bringing down lower temperatures than normal into central and eastern parts of the United States and Canada.
The clearest atmospheric signature of the new El Niño is detected using the Velocity Potential forecast at the 200mb level (12km/7.5miles altitude). This shows us areas of rising and sinking air, revealing the broad atmospheric circulation, and the earlier-mentioned atmospheric bridge that develops in an El Niño.
The latest July ECMWF forecast shows a substantial anomaly of rising air over the Pacific and sinking air over the Indian Ocean, revealing a clear El Niño flow or the atmospheric bridge. This, along with the June pattern above, confirms firmly that the El Niño pattern is already here, starting to spread its impact on the global circulation.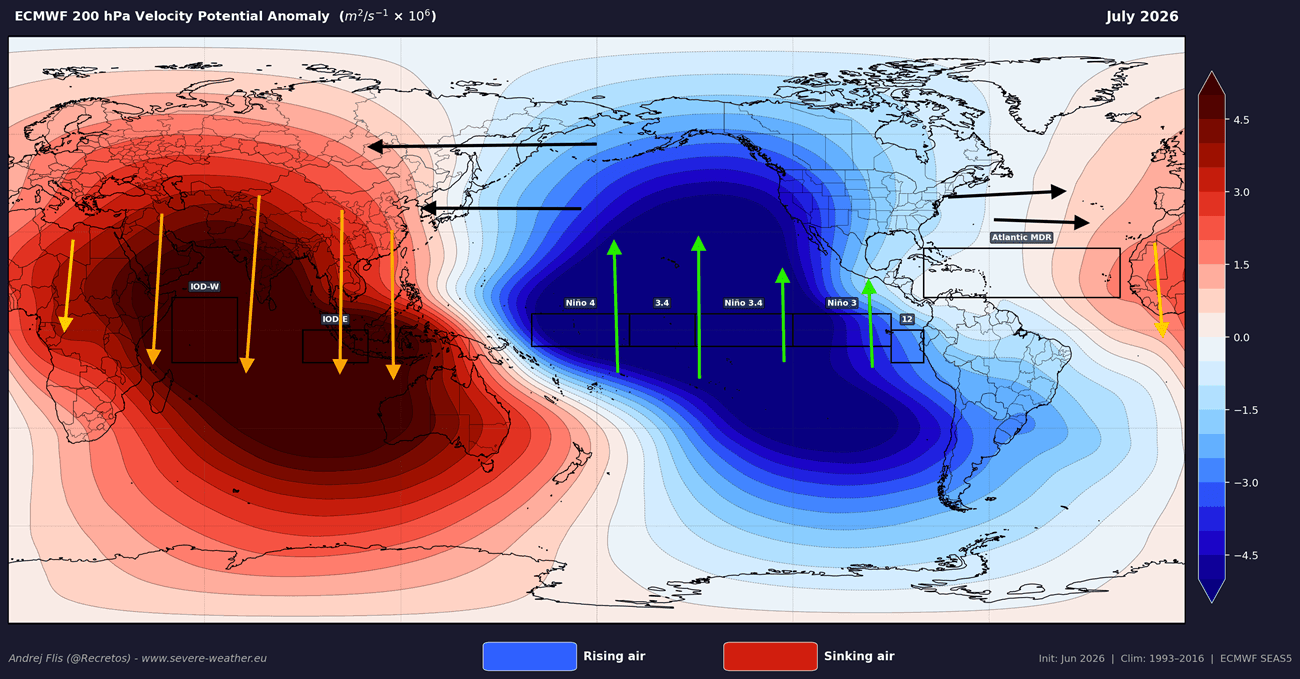
Overall, we can see that this year we are on the proper super El Niño path at this stage of development. We can use this information to look at the latest July weather pattern trends and reveal the clear El Niño atmospheric signature.
Below is the July pressure pattern in super El Niño years, and it shows some change in flow. The main low-pressure area over North America is further to the west, allowing a warm southerly flow to build in the central and eastern parts of the United States and Canada, under a high-pressure ridge. At the same time, a cooler flow is over the west coast.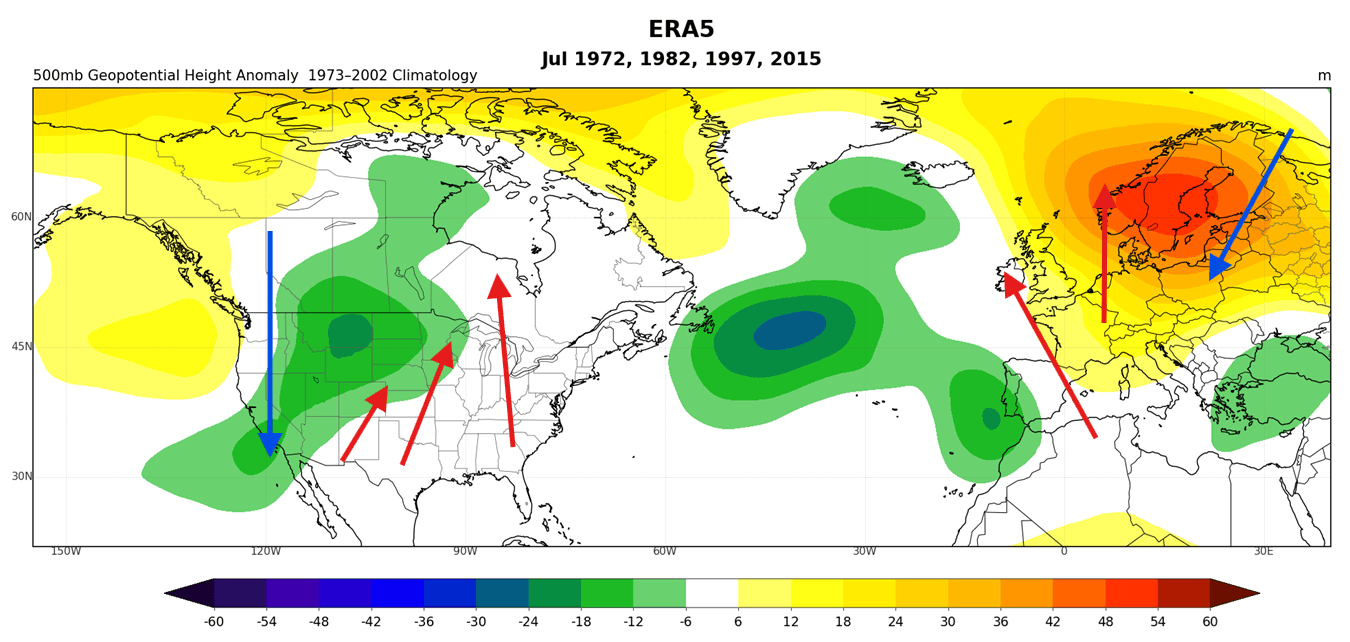
A strong high-pressure blocking anomaly is visible over northern Europe, a signature that we will look out for in the later stages of the month.
Looking ahead into the first third of July, you can see the pressure pattern forecast below. It also shows the low-pressure area in the western United States. This allows a high-pressure ridge to build over the central and eastern United States and deep into Canada, powering a strong warm southerly flow.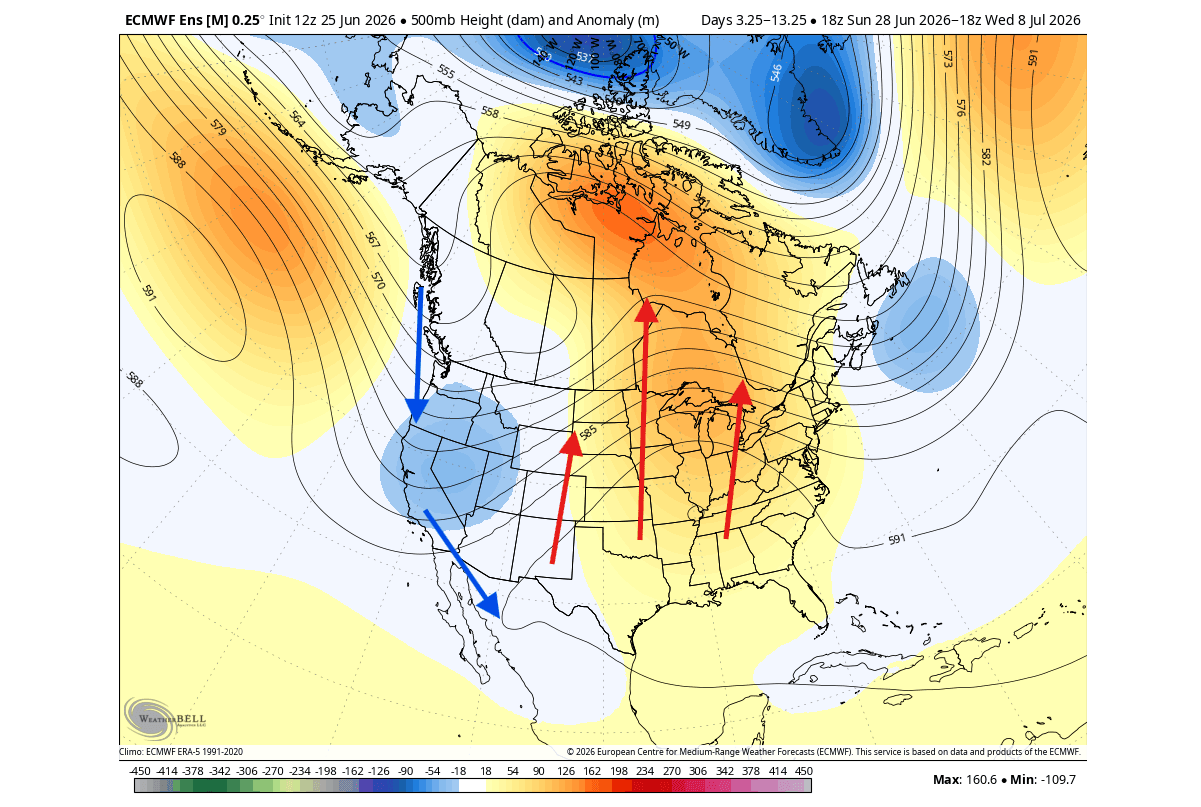
This anomaly does not look far off in the flow, compared to the past super El Niño July pattern above. But of course, each event has its own details and nuances, and we are looking at just one part of the month, while the analysis for past super El Niño events above is a full monthly anomaly.
The surface temperature pattern reveals the full story, as expected from the pressure systems. A strong warm anomaly will rise into the central, eastern, and northern parts of the United States and Canada. A cooler flow will engulf the far western parts.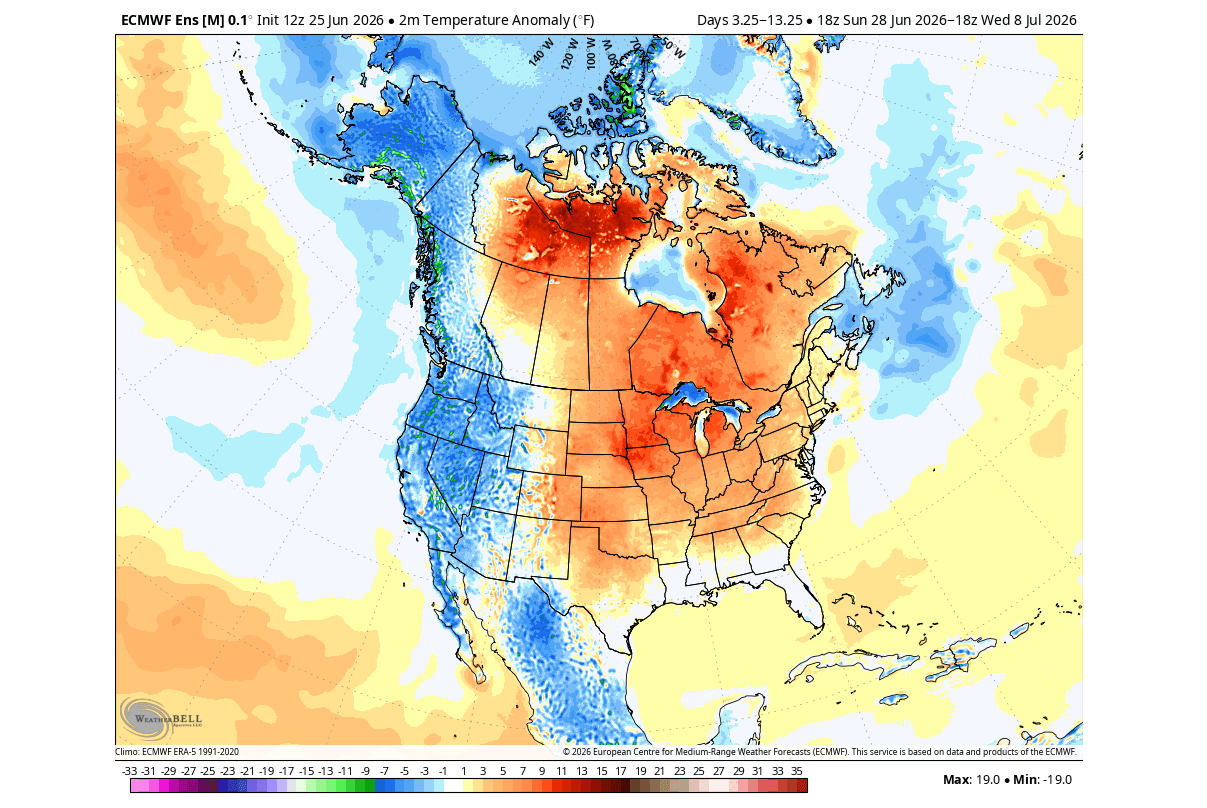
A dry warmer flow and high pressure mean less precipitation over the Midwest, Plains, and parts of the eastern United States and Canada. This is confirmed in the precipitation forecast below. But with the Pacific jet stream getting stronger during an El Niño, we see a slow trend toward more rainfall over the far southern United States.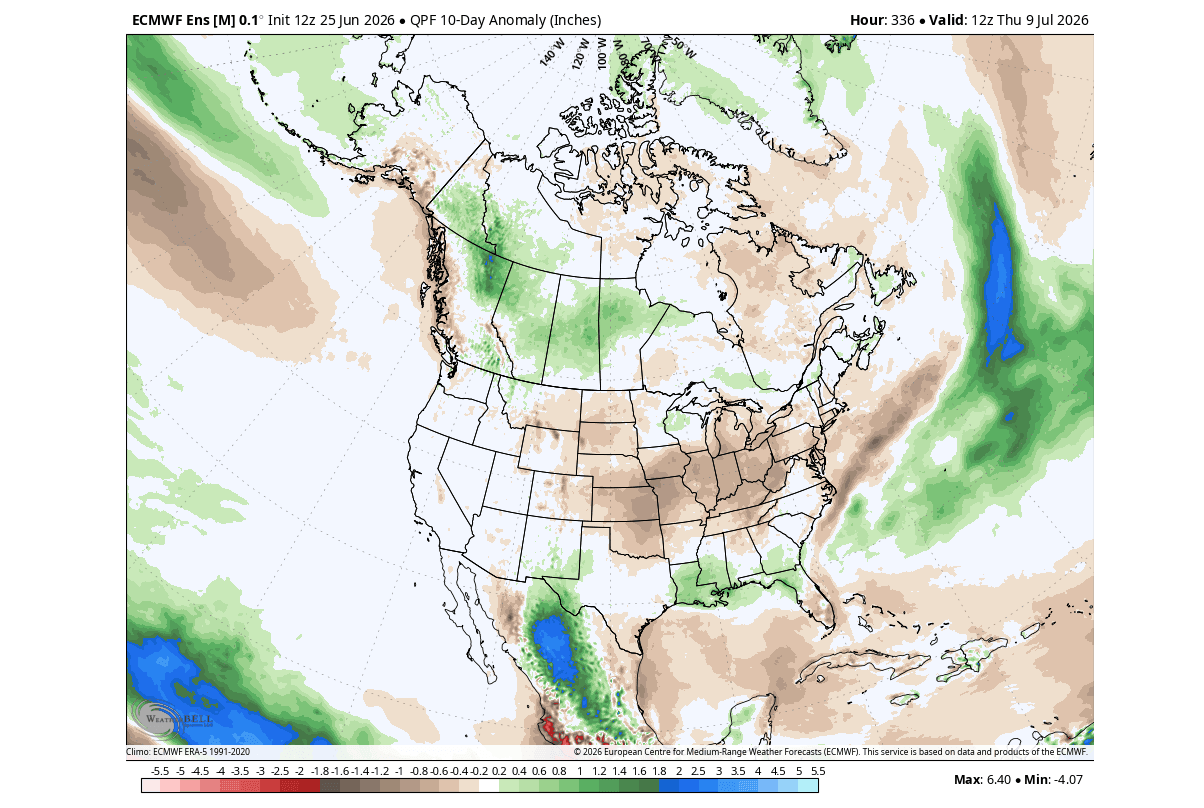
The ECMWF ensemble forecast for atmospheric motion shows a large persistent area of rising air over the central and eastern Pacific, with a sinking anomaly over the Indian Ocean. This is the direct forecast confirmation of the El Niño presence in the atmosphere, getting stronger as we head into July.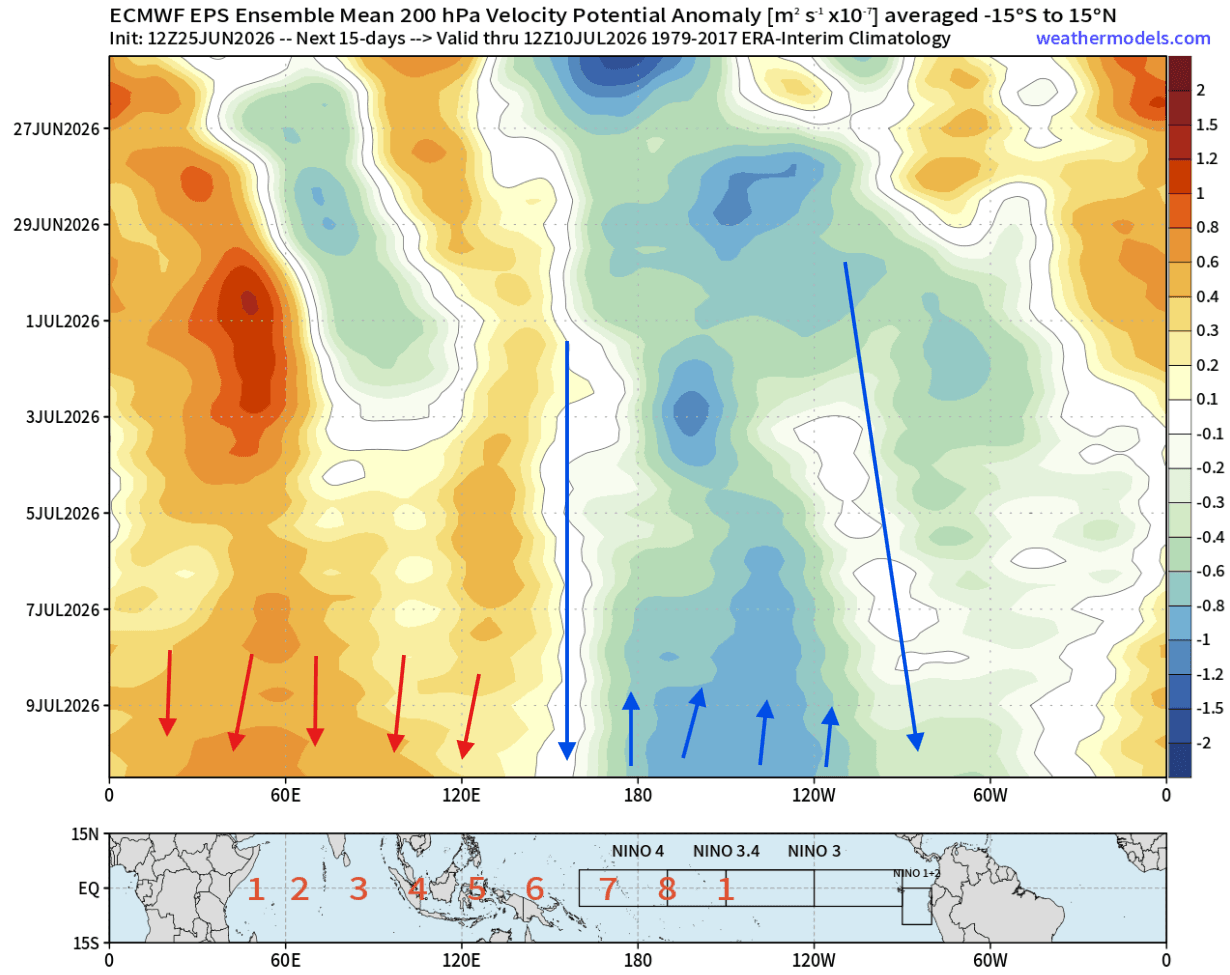
This means that the deeper we go into Summer, the stronger the impact that we can see and feel from the rising super El Niño.
Below is the latest extended ensemble forecast trend for mid-July. It shows a pressure setup trending more back towards the typical June El Niño pattern: A low-pressure tendency over eastern Canada, extending into the northeastern United States and the east coast. That usually brings a normal to below-normal temperature trend to the eastern U.S., but a heat dome over the west-central U.S. and Canada.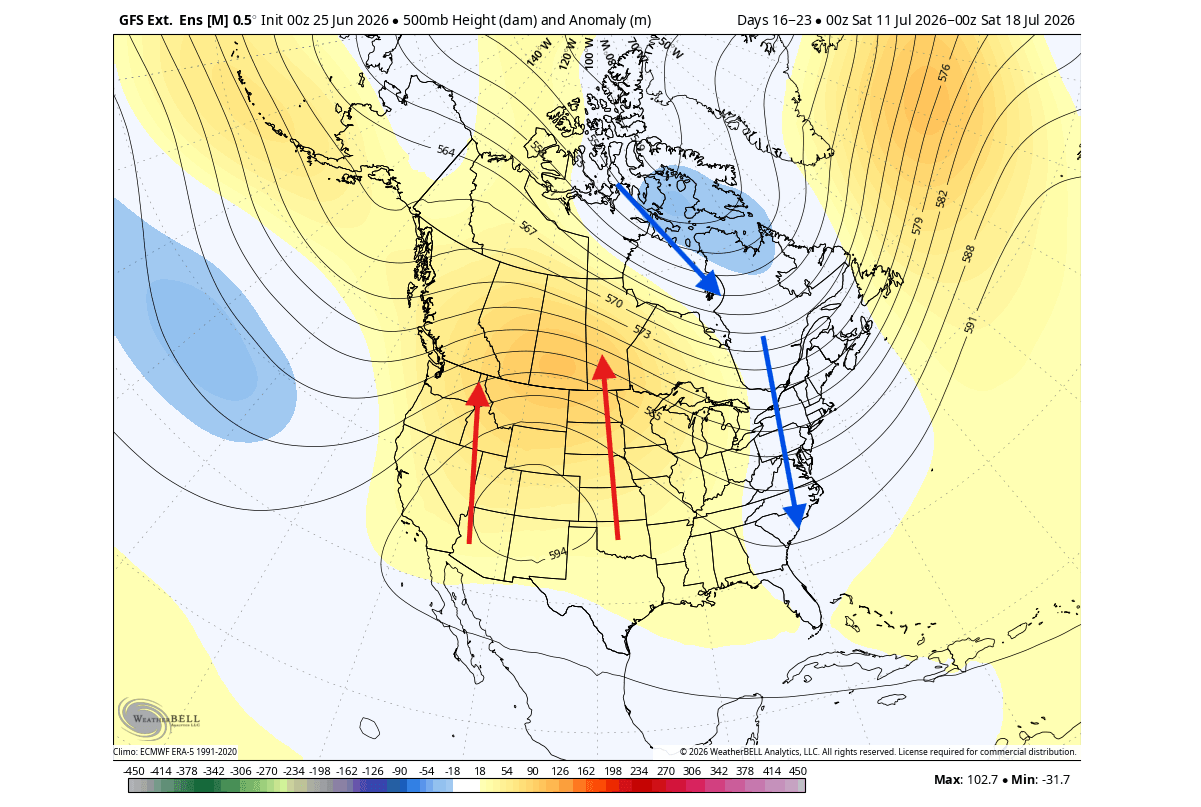
But going into late July, the forecasts show another shift, now looking again more like the July super El Niño analysis above. A low-pressure trending back towards the western U.S. with an undercut to the high-pressure ridge, pushing it north, along with the warm anomalies.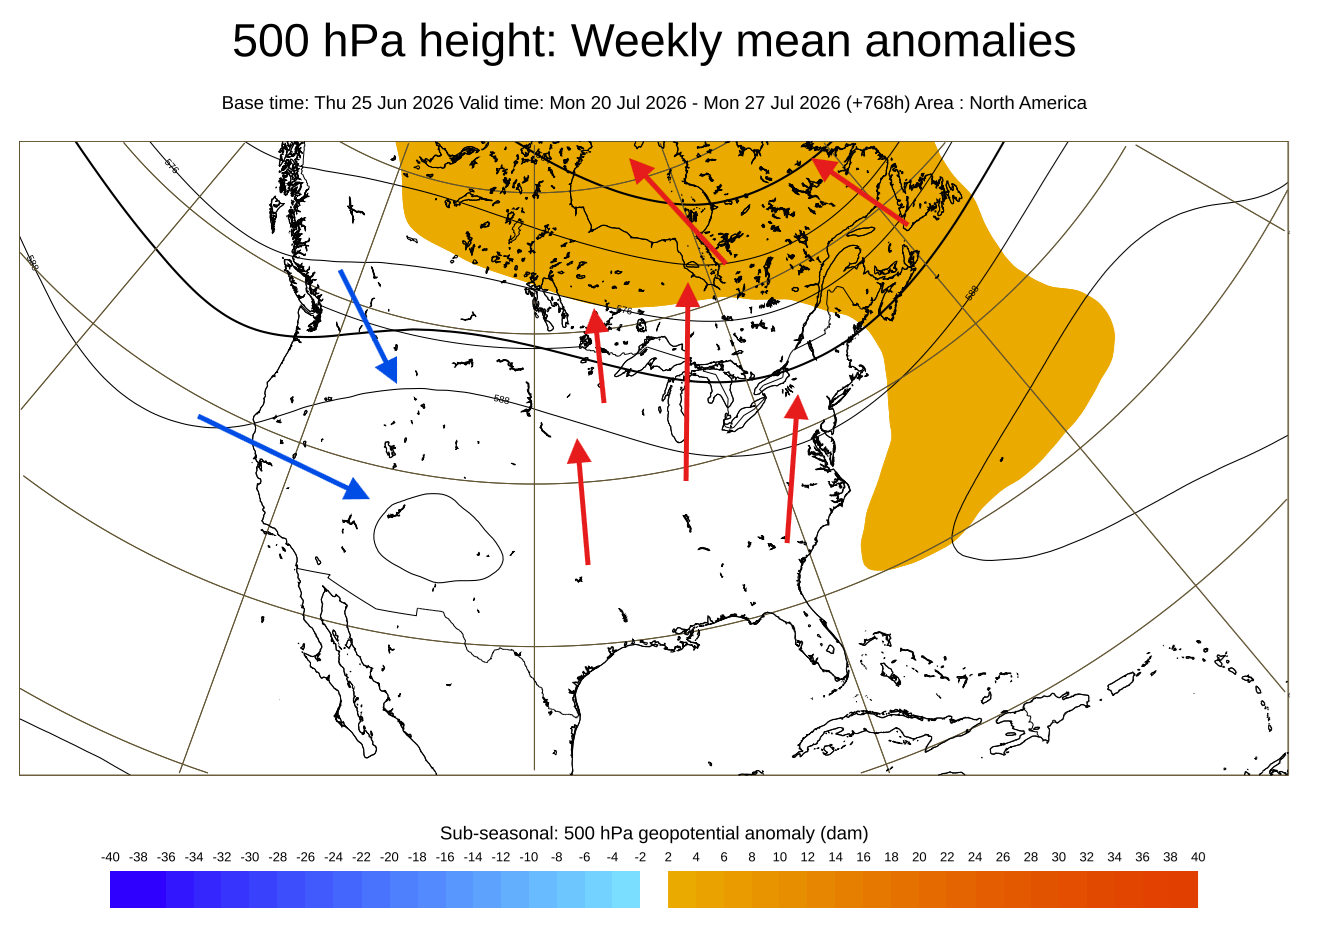
This is actually very interesting, as it looks like the atmosphere is playing ping-pong with pressure systems, but always reflecting an El Niño-driven pattern.
The temperature trends for mid-July (left) also show a pattern similar to that of the historical June analysis above. A normal or below normal temperature area over eastern Canada, also expanding into parts of the Midwest and the northeastern United States.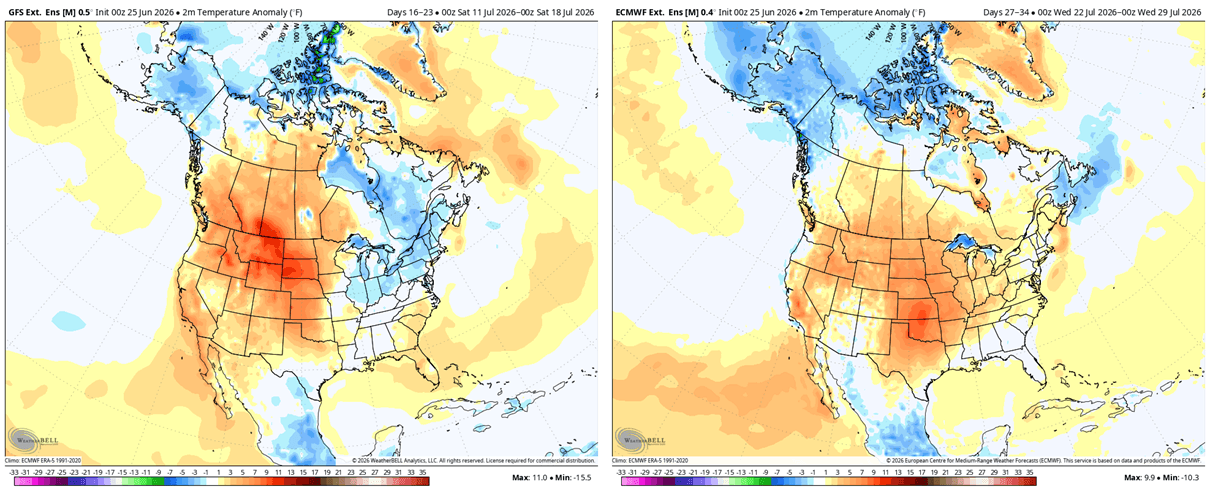
For late July (right), the latest trends show warm temperature anomalies expanding back to the east as a low-pressure undercut begins, amplifying the warm southerly flow.
And if we look at the rainfall forecast for the whole of July, we can start to see indications of a below-normal rainfall trend across the central United States, the northern Plains, the upper Midwest, the Pacific Northwest, and Florida. More rainfall is forecast over the southwest, and in parts of the eastern and northeastern U.S. and Canada.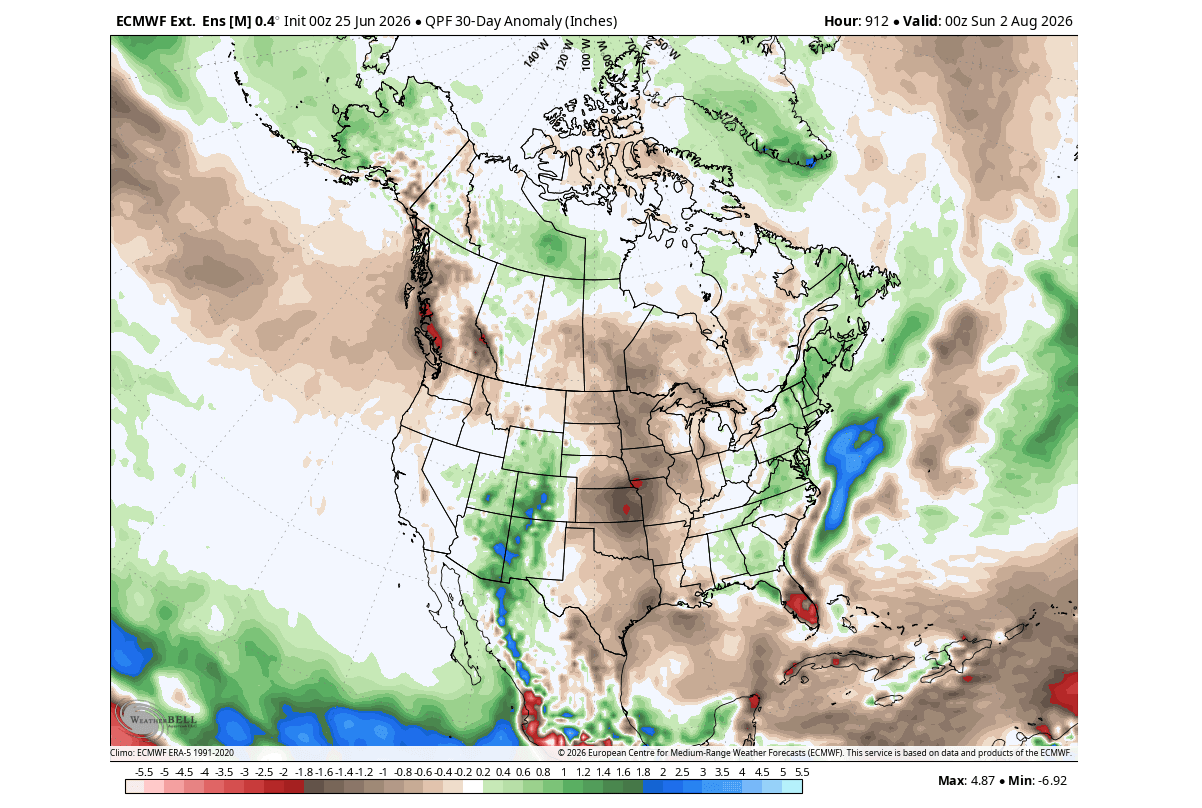
We left Europe out for now, as it did not show any major signal that would be compatible with past super El Niño events. But looking at the end of July trends, we are starting to see the high-pressure blocking pattern emerging, similar to the one seen in the past July analysis for super El Niño years.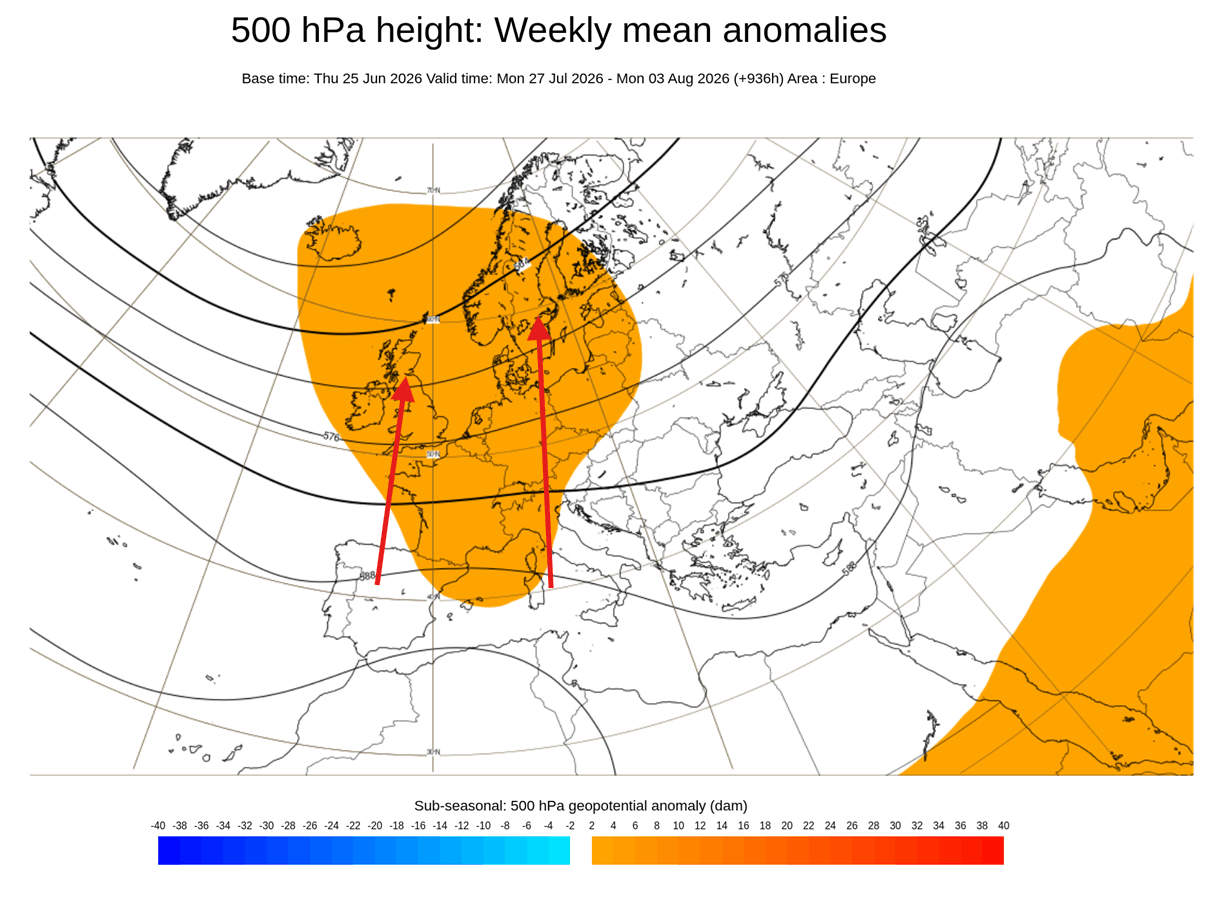
In summary, the latest forecast data and historical analysis confirm that the 2026 El Niño is showing a real tendency to lock down atmospheric patterns by late Summer and into Fall across the United States and Canada, and also spreading its grip into Europe.
Below is the analysis of the late Summer and early Fall (August-October) pressure anomaly during the last 4 super El Niño events. The data shows a high-pressure anomaly over the central United States, extending all the way into southern Canada. A low-pressure area is over the west coast, and another one is over Canada, extending into the eastern United States.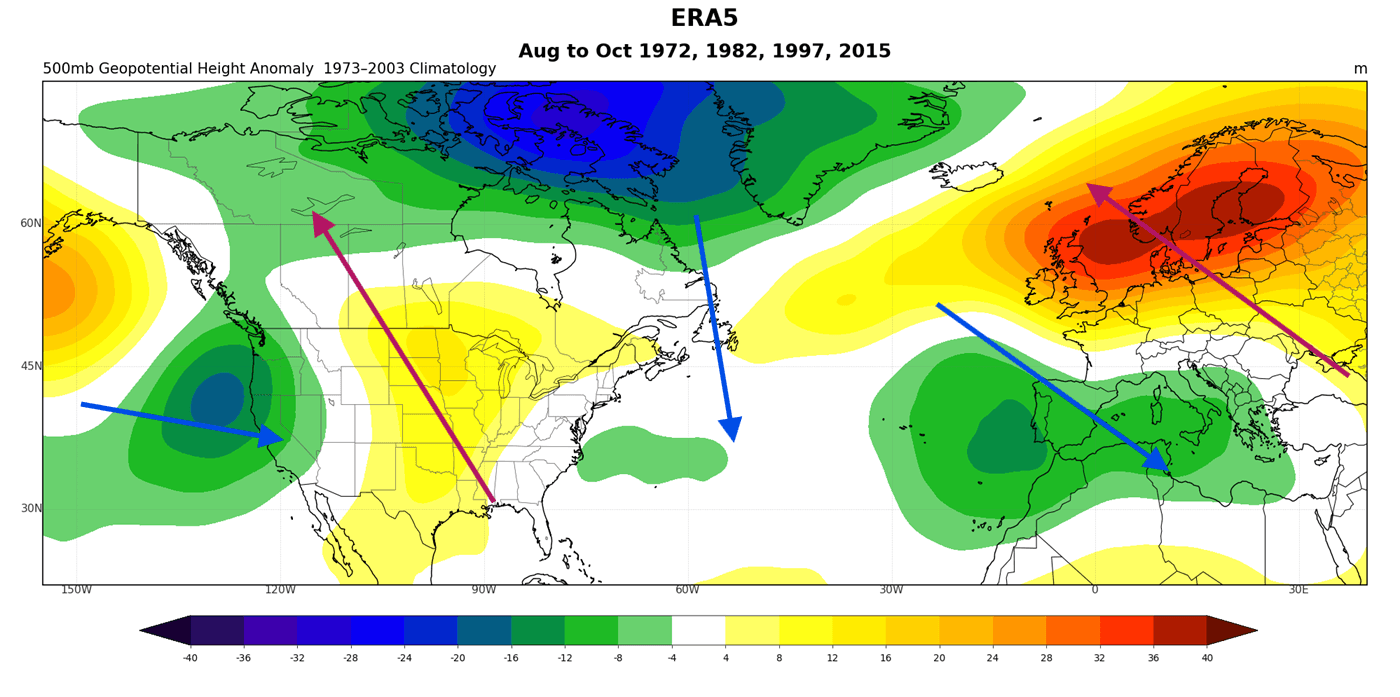
Over Europe, we see a reversed pattern, with a strong blocking high-pressure anomaly over the northern and north-central parts, and a low-pressure anomaly undercut over the southern half. This is a Rex-block type pattern, while over North America, we see an Omega blocking trend.
Looking at the latest forecast from ECMWF, it shows an incredibly similar pattern across North America and Europe. We can see the high-pressure trend over the northern and central United States and into western Canada. And two low-pressure areas in the Pacific towards the west coast and over eastern Canada, impacting the eastern U.S. areas.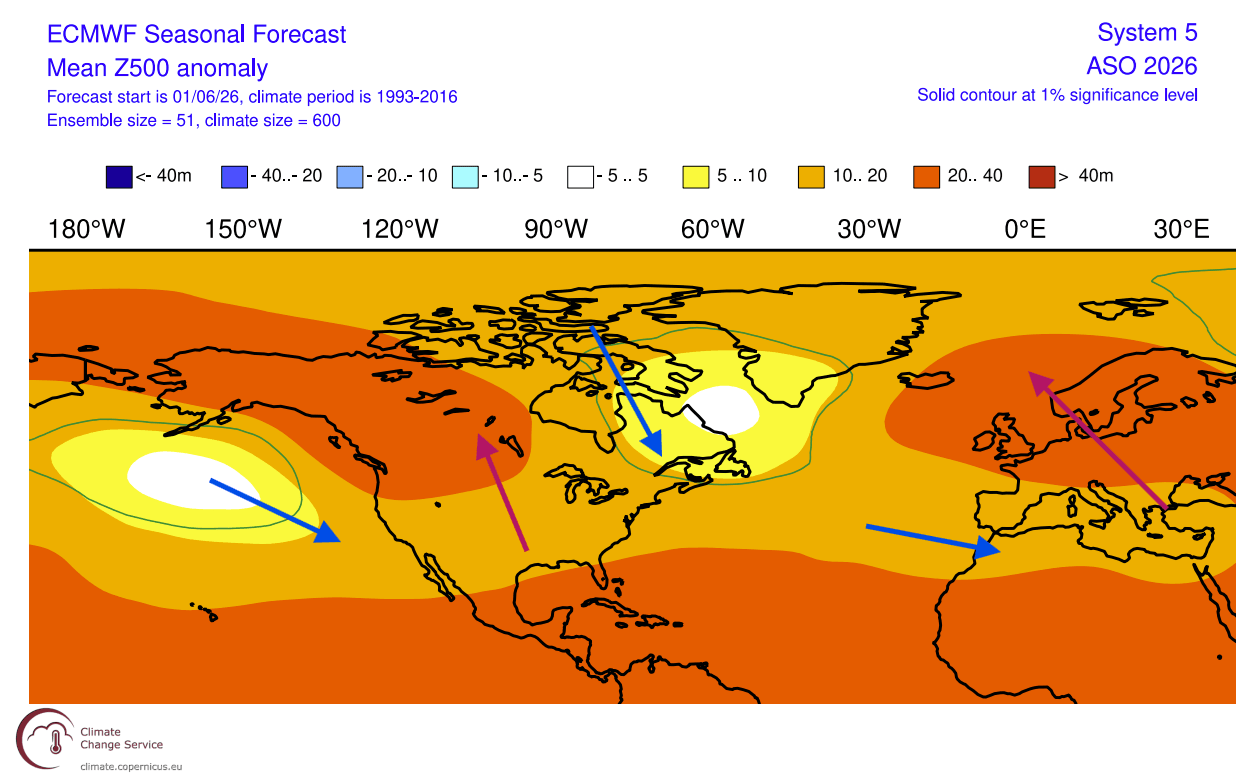
The pattern over Europe is even closer to identical, with a blocking high anomaly over the northern and north-central parts, and a low-pressure tendency in the southern parts. This is one of the more clear super El Niño signals in 2026 so far, looking to grip the pattern over Europe for Fall and Winter.
The airmass temperature analysis for the same period shows the expected pattern. Warmer weather in the south-central United States, the central and northern Plains, and southern Canada. We see below-normal tendency over the western and northeastern parts of the United States, and over northern and eastern Canada.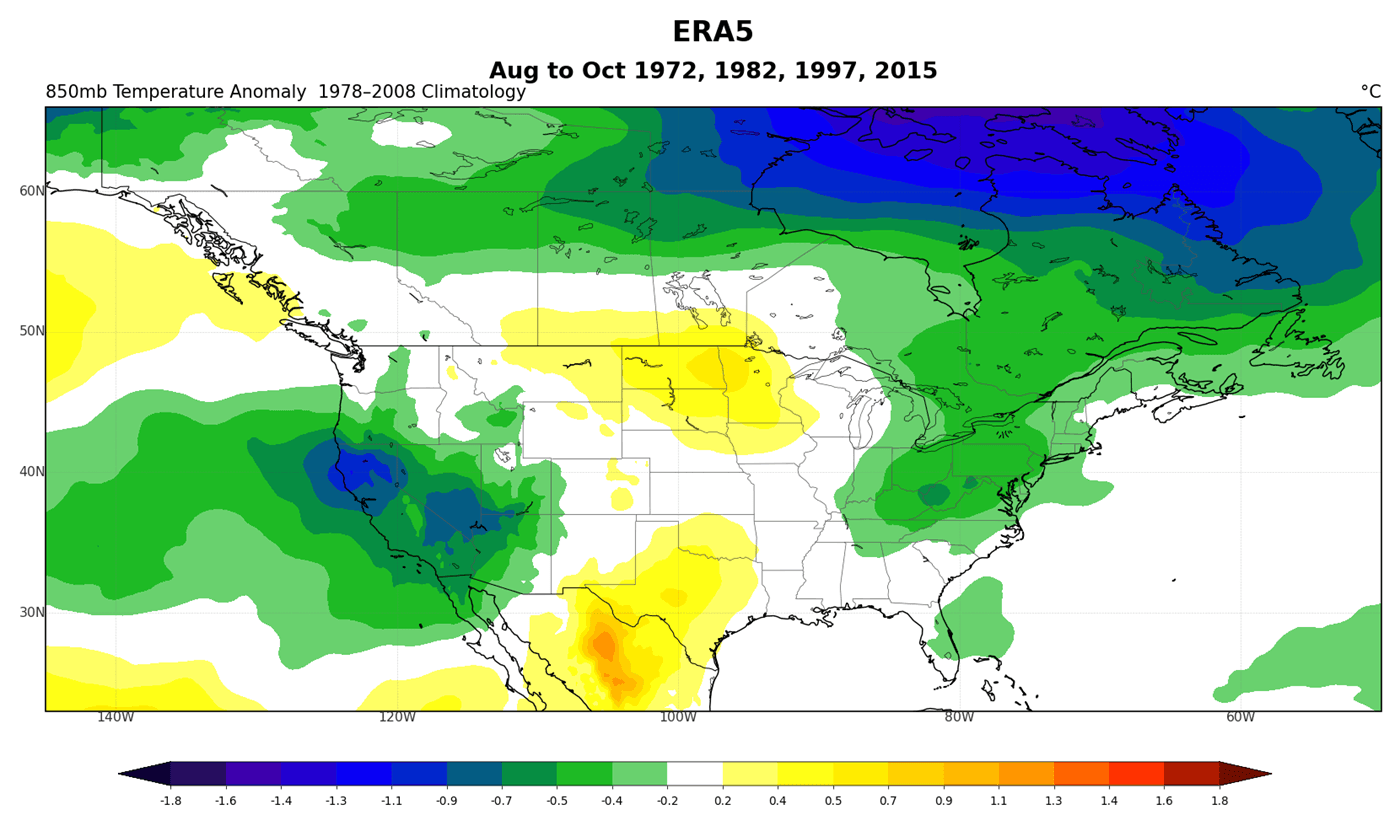
We used the 1978-2008 climatology for this plot, since the event years are from older decades. This helps to normalize the anomaly pattern due to a different climate normal in older decades.
We can see this pattern reflected in the latest late summer-fall forecast: A warm airmass anomaly from the southern, central, and northern United States, into southern and western Canada. But notice the normal-to-below-normal tendency areas over the southwestern U.S. and eastern Canada.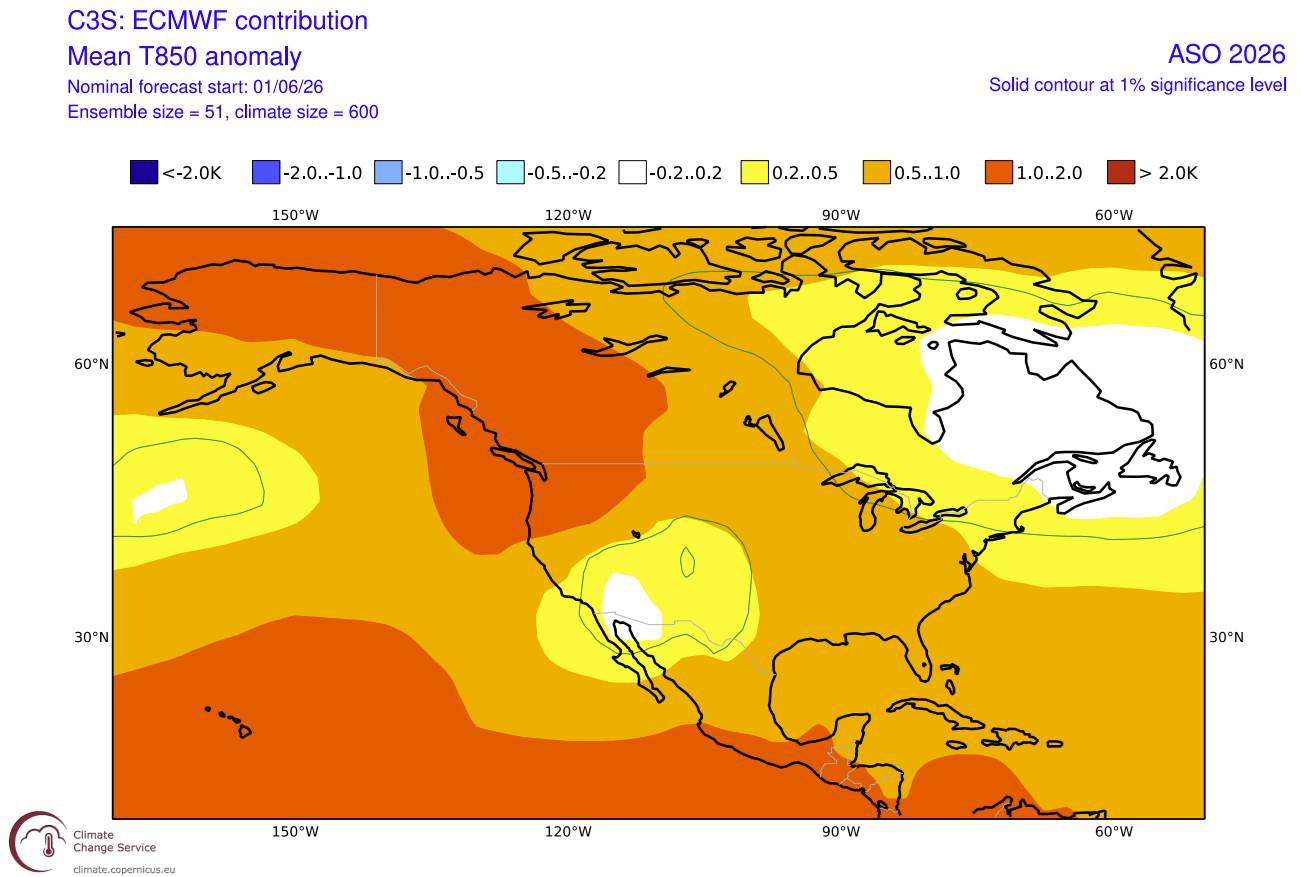
This shows a visible confirmation that the forecast August-October pattern shows a very similar atmospheric signature to past super El Niño events. There is only a small over the western United States, with the anomaly further east, but that’s normal event-to-event variation, and the overall pattern looks clearly driven by the super El Niño.
Over Europe, the airmass temperature anomaly for past events shows the expected warm north and colder south development for the late Summer-early Fall period. This is due to high pressure blocking over the northern half and the low pressure over the south.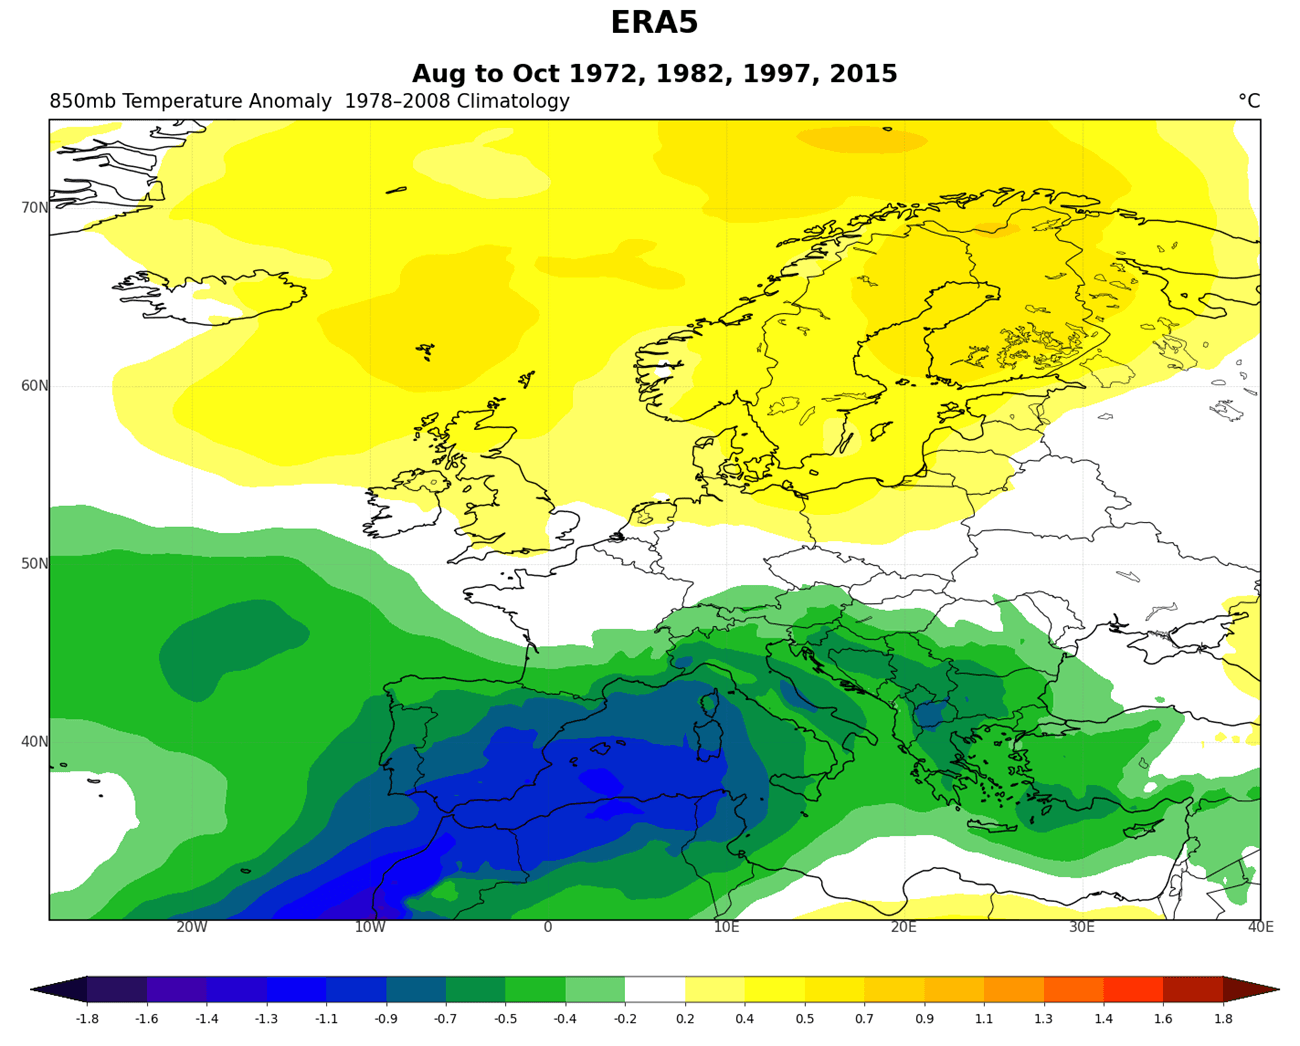
The ECMWF forecast for the same period and parameter shows a slightly different distribution, with the core warm anomaly being lower down, over the north-central and northern parts. The normal and below-normal trends are indicated over the southwestern and southeastern parts, where they would be expected.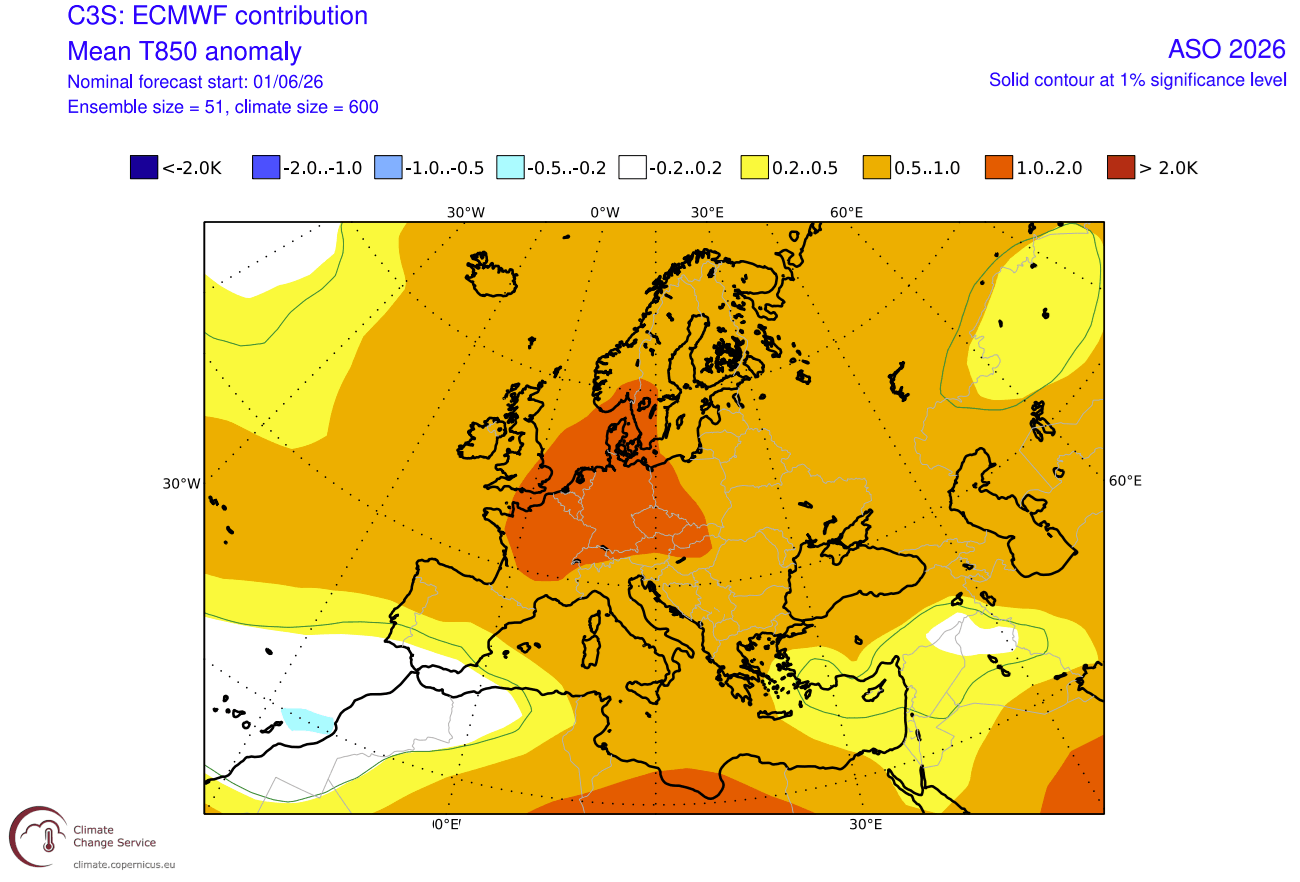
It doesn’t show widespread below-normal anomalies, due to the different climate normal versus the older super El Niño events. But we are without a doubt seeing a very similar atmospheric development, confirming the super El Niño impacts starting to spread into Europe by Fall.
We will look more in depth at the Fall seasonal weather patterns across the United States, Canada, and Europe, as soon as the updated long-range data is available next month.
Forecast and analysis images in this article are from cyclonicwx.com, weathermodels.com, Copernicus EU, and WeatherBell, using a commercial license.
We will keep you updated on global weather development and long-range outlooks, so bookmark our page. Also, if you have seen this article in the Google App (Discover) feed, click the like button to see more of our forecasts and our latest articles on weather and nature in general.
Don’t miss:
A Seasonal Weather Shift Is Forming as Super El Niño Merges with Record-Low Arctic Sea Ice for 2026/2027
Europe’s Excessive Heat Warning: Record June Heat Dome Spikes France to 45°C, UK Eyes 40 °C
Recent Posts
RSS Feed
“Follow severe weather as it happens. Anywhere. Any time.” © Severe Weather Europe 2025
Leave a Reply